 |
||||
| This is the Official website of the Magi Society and the only authorized website for Magi Astrology™ | ||||
|
||||
|
||||
|
HOW THE PLANETS MAKE STOCK PRICES CHANGE DIRECTIONS FIBONACCI RATIOS WORK BECAUSE THEY MATCH THE ORBITS OF THE PLANETS
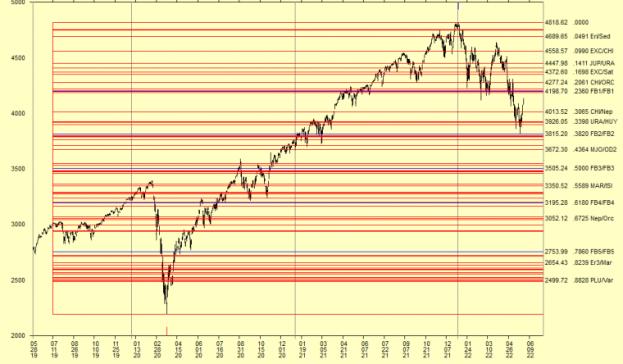
May 28, 2022 Believe it or not, every day that the stock market is open is a day that proves the planets have a measurable influence on what happens on Earth. Whenever the stock market is open, stock prices will move up or down and sideways and every which way, in what is seemingly a random walk that is totally unpredictable. Some experts tell us the stock market is unpredictable and nearly all say you cannot time the market. But it is predictable! If you understand some very simple secrets of the planets, you can actually see order and predictability in the movement of stock prices. You can know ahead of time the statistically most logical times when stock prices are most likely to change directions. Lets give you examples of what we are talking about. Below is a stock chart of the S & P 500 Index from May 2019 until last Friday May 27, 2022. All charts in this article are drawn using our Magi Society AstroFibonacci software program):
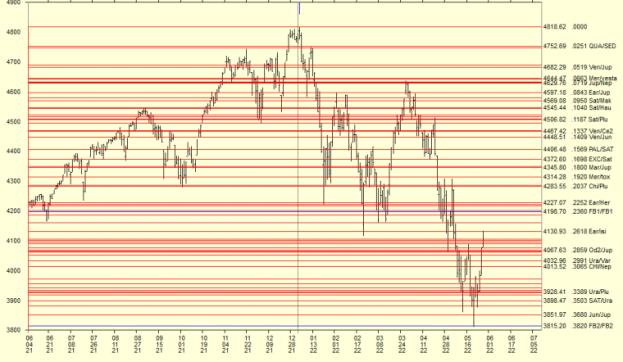
If you follow the US stock markets, then you already know that this has been a horrific two months for stock investors because stock prices dropped for eight straight weeks ending May 21, 2022 that was the worst performance in the US stock market in 100 years! US stock prices finally went up the following week, May 23 to May 27, 2022 and actually rose 7 per cent in just one week. Very few predicted this. You could have been one of the smart ones if you follow the planets and know a little Magi Astrology and also understand some technical analysis tools for stock charts. The secret is in the stars and Fibonacci Ratios. Fibonacci Ratios are astrologically derived and mystically powerful and we discuss them in detail on the home page of our website at stockmarketcompass.com. (If you do not understand what Fibonacci Ratios are, please go to our website at stockmarketcompass.com and learn about Fibonacci Ratios by clicking here and read the home page. In the chart above, the low in price for the S & P 500 was 2191.26 and it was made Mar 23, 2020 during the COVID pandemic fiasco. In the above chart, the high in price for the S & P 500 was 4818.62 and that was made on January 4, 2022, just four months ago. The five key Fibonacci Ratio Support levels are: 4198.70 (the .236 ratio) and 3815.20 (the .382 ratio) 3505.24 (the .500 ratio) 3195.28 (the .618 ratio) 2753.99 (the .786 ratio) These five S & P 500 prices are marked on the above chart by the five thin blue horizontal lines. The Rule of Fibonacci predicts that when the S & P 500 index is at the one of the five key Fibonacci Ratios Levels, then stock prices would find very strong support and make a stand and bounce up. That is exactly what happened in both of the cases when the SP500 index did get down to one of the five levels. You can see this better using the stock chart below which is an enlarged version of the one above for the last six months:
You can see that when the S & P 500 indexs price got down to one of the blue horizontal lines (which are the Fibonacci levels) the stock market found support and bounced up. But what is even more interesting to notice in the new chart above is that when the stock market was falling, or rising, almost every single time stock prices made a major CHANGE IN DIRECTION, then THAT CHANGE OCCURRED AT A PRICE LEVEL THAT WAS AN ASTROFIBONACCI PRICE LEVEL. In other words, when the stock market changes directions, it is almost always at an AstroFibonacci level, which is represented by the red or blue horizontal lines in the above chart. Each horizontal red or line represents an AstroFibonacci Level. By our count, 36 of the 39 major turns came at an AstroFibonacci level. Stock prices rarely make turns in the yellow blank areas of the stock chart above. Each AstroFibonacci ratio is created by the movement of the planets an AstroFibonacci Ratio is the ratio of how long it takes for two planets to orbit the sun. This gives us incontrovertible evidence that planetary dynamics and the movement and motion of planets have a direct influence on stock prices on earth. The Magi Society is the discoverer of AstroFibonacci ratios and many other breakthroughs in astrology. If you would like to learn about AstroFibonnaci software, please click on the link below: https://magiastrology.com/softwareinfo/financialastrology/index.php
HOW YOU CAN LEARN MAGI ASTROLOGY AND GAIN THE MAGI ADVANTAGE Only Magi Astrology helps you to better understand the past and helps you better predict the future so that you can improve the future for yourself. Magi Astrology is easy to learn and is the only form of astrology that actually helps you to improve your life. With Magi Astrology, you can improve your love life and your career; and you can avoid heartbreaks in both love and business. This may sound like quite an exaggeration but please judge for yourself. We invite you to a free download of the first 14 chapters of our third book by clicking here. Reading these chapters is the best way to begin to learn Magi Astrology. MAGI ASTROLOGY REALLY WORKS! Since 1999, we have been able to consistently use the simple rules of Magi Astrology to explain the love life of hundreds of famous people on our websites because Magi Astrology Really Works. This website has hundreds of articles all backing up the fact that Magi Astrology Really Works. If you would like to gain the Magi Advantage and improve your life, please consider joining the Magi Society. We are an open society, meaning anyone is welcome, and you are not obligated to help the society in any way if you become a member. EVERY MEMBER RECEIVES FREE SOFTWARE program from us called: ASTROGEOMETRY SOFTWARE Membership is still just $80 for the first year and $55 for each additional year. The Magi Society is the worlds largest association of astrologers with over 5500 members in 39 countries worldwide. The Magi Society provides all of our members free software that is so versatile you can use it to cast charts for both Traditional Astrology and Magi Astrology. Of course our software includes the Saturn/Chiron and Saturn/Jupiter midpoints. But only Magi Society software can help you to fully utilize Magi Astrology principles because only Magi Society software helps you see Planetary Geometry and the true alignments of the planets. Magi Society members may also purchase optional interpretations upgrades that provide not only superbly accurate interpretations but also great advice that give you the Magi Advantage. There are other valuable benefits of membership in the Magi Society. We offer a free Certification Program for our members who would like to build a career as a professional astrologer, either full time or part time (and if you join us for at least five years). We also hold Magi Astrology Workshops by conference calls so that our members may more easily learn Magi Astrology. If you would like information on our software and/or other membership benefits, please click here.
|
||||
|
© 1999-2023 by Magi Astrologers Worldwide Corporation. All Rights Reserved. IMPORTANT DISCLAIMER: By reading any of the material on this website you agree to our DISCLAIMER: The Magi Society and The Magi Astrologers Worldwide Corporation make no claims whatsoever concerning the validity of the information provided herein, and will not be held liable for any use thereof. No information or opinion expressed here is a solicitation to buy or sell securities, bonds, real estate, commodities, options, futures or any financial instruments whatsoever. |