 |
|||||||||||||||||||||||||||||||||
| This is the Official website of the Magi Society and the only authorized website for Magi Astrology™ | |||||||||||||||||||||||||||||||||
|
|||||||||||||||||||||||||||||||||
|
|||||||||||||||||||||||||||||||||
|
How to Predict Stock Market Turns
March 8, 2022 [Editor Note: This is an article about Financial Astrology and is written for traders the terminology we use will not be familiar to the general public, but very easily understood by knowledgeable stock, commodity and currency traders.] Beginning at the start of this year, the stock market entered into a period of wild volatility. Investors and traders are now gripped by fear because of the Russian invasion of Ukraine, relentlessly rising inflation and as of yesterday, we can add the risk of recession to the stock markets big problems. But if you are a Magi Astrology Trader, you can take advantage of volatility because a good trader makes the most money during highly volatile markets. For example, on February 24, the S&P opened at 4155 but closed 132 handles higher for a 3% gain the TQQQ was up 9%. If you caught even just a chunk of that rally, you could have made 5% - not bad for a few hours of work. A Magi Astrology Trader watches the markets and knows that every minute of every hour when stocks are being traded, stock prices go up or down AND we know as we watch our streaming graphs on our monitors, we can literally see with our eyes that the motion of planets is having a strong influence on stock prices. With the help of an astrological tool made popular by the Magi Society, you too can see the influence of the planets on stock prices. We are referring to Planetary Motion Ratios. WHAT IS A PLANETARY MOTION RATIO? A Planetary Motion Ratio is the ratio of one planets PERIOD (time to revolve once around the Sun) and another planets period. For example: The period of Venus is 224.70 days. The period of the Earth is 365.256 days. The Venus/Earth Planetary Motion Ratio is = 224.7 divided by 365.256 which is: 0.6151 The Mercury/Venus Planetary Motion Ratio is = 87.969 divided by 224.7 which is: 0.3902 These ratios are Fibonacci Ratios the Golden Tool of traders all over the world. It is planetary motions that actually creates Fibonacci Ratios and make them work. The table below lists the sequential Planetary Motion Ratios. (This website is a website of the Magi Society, the worlds largest association of astrologers and inventor of Magi Astrology. Magi Astrology includes Ceres, which is now recognized by the IAU as a planet, and Chiron, which is the most important Financial Planet in Magi Astrology.)
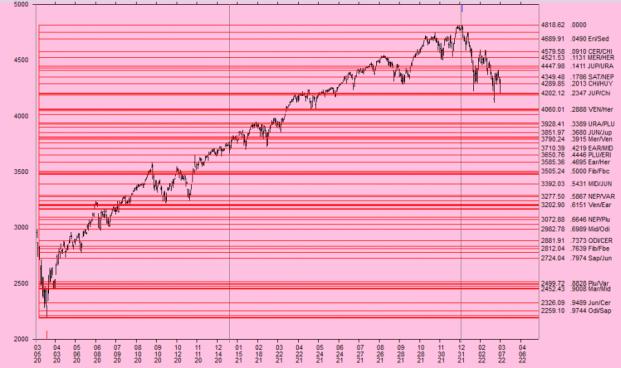
The above ratios are sequential ratios meaning they are made by the periods of the planets that are in sequence such as Earth and Mars, which are in sequence because the earth is the third planet from the Sun and Mars is the fourth planet. There are also non-sequential ratios for example the Jupiter/Chiron ratio is 0.2347 (a Fibonacci ratio) and this is made by the planetary motion ratios of the fifth and seventh planets from the Sun. We call this type of planet ratio a leap ratio. (A ratio made between the fifth and sixth planets is a sequential ratio.) Below is a two-year daily S & P 500 stock chart. There are horizontal lines showing the price levels based on Planetary Motion Ratios for each sequential leap ratio. These ratio levels are based on the low in price for the S & P 500 made on March 23 2020 (the COVID low) and the high in price made on January 4, 2022 (the all-time high).
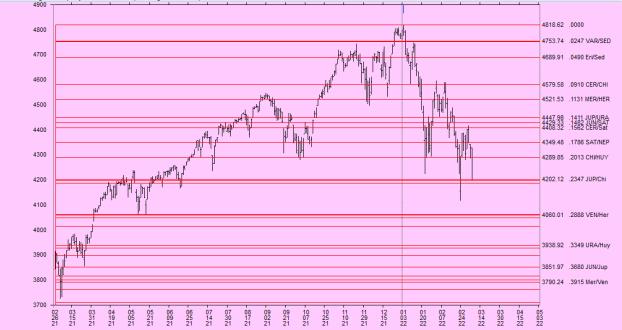
The planetary motion ratios are shown on the right margin of the above chart along with the three letter abbreviations of the planets that make the ratio. On the margin we show you the SP500 price, the ratio and the planet abbreviations. The important point of the above stock graph is that you can see that the stock prices will find support and resistance at the levels defined by the Planetary Motion Ratios, and they are the most likely times when the stock market will make a turn. For examples, look at the enlarged stock chart below, which is the SP500 chart for not two years (like the chart above) but only a portion of the two years so that the chart is larger and you can see more precisely what happened day to day in the US stock market.
Please look at the chart above and focus just on the part on the right after the market topped out and started going down. You will see that every major multi-day change in direction made by the stock market was made at a price level that was equal to a Planetary Motion Ratio price level. This type of information is invaluable for stock traders and investors. Magi Astrology is the study of planetary rhythms. We believe that Magi Astrology is the best tool for studying stock and commodity prices. We are not claiming that Planetary Motion Ratios will make you megabucks in stock or commodity trading. But we do believe that Planetary Motion is one of the clues that can help us improve our ability to predict future stock and commodity prices, especially the 2-3-4 day swings. Planetary Motion is a valuable FILTER for traders and investors. If we are correct 60% of the time using Planetary Motion analysis as a FILTER, and if we are correct 60% of the time using technical analysis as an ADDITIONAL FILTER, then by combining the TWO FILTERS, we would be correct maybe as much as 70% of the time? The Magi Society offers an amazing Financial Astrology Research Program called AstroFibonacci. It is only $475 for the basic program. Please click here to read more about it.
|