 |
||||
| This is the Official website of the Magi Society and the only authorized website for Magi Astrology™ | ||||
|
||||
|
||||
|
HOW TO PREDICT STOCK MARKET TURNS - PART 2 YOU CAN PREDICT STOCK MARKET TURNS Better Than Anyone Else By Utilizing Magi Society AstroFibonacci Ratios
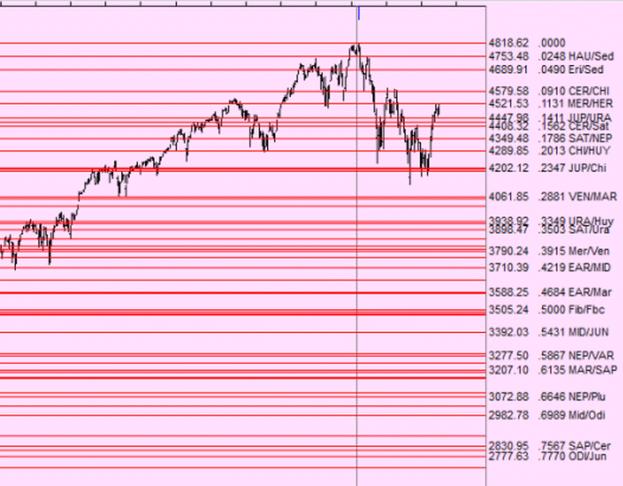
March 24, 2022 Just two weeks ago on March 8, 2022, we posted an article on this website entitled How to Predict Stock Market Turns. Please read that article by clicking here. In the article, we proposed the Magi Society theory that stock prices are most likely to CHANGE DIRECTION at levels defined by Planetary Motion Ratios. It is now twelve days later and during those twelve days, the stock market has proven that we were correct! Every important turn made by the US stock market during the last 12 trading days was made when stock prices were at a level defined by Planetary Motion Ratios. Here is a stock chart of the S & P 500 that illustrates what we mean:
The red horizontal lines define the price levels that are created by an important Planetary Motion Ratio. During the last twelve trading days, every important turn was made at, or really close to, one of those price levels, as you can see by the red horizontal lines. For example, when the S & P 500 Index got UP to 4521.53, stocks prices CHANGED DIRECTION and went DOWN. The 4521.53 price level is defined by the Mercury/Hermes planetary motion ratio, and you can see both of the price and planet abbreviations on the right side of the above chart. To see all of this better, below is a very much enlarged stock chart:
You can also see that on each day that the stock market went up and hit a different planetary period ratio level, stock prices met resistance and usually at least paused its movement up by pausing until the next day to go higher. If you are an experienced stock or commodity or currency trader, you know how to read charts such as the one above and you can now have evidence that stock prices are most likely to turn at Planetary Period Ratio levels. The term Planetary Period Ratio is too klunky so we have proposed long ago that the better term to use is AstroFibonacci Ratio. We are confident that AstroFibonacci Ratios are the single best predictor of stock price turning points not perfect, of course, but it can give all traders a great technical tool that helps to gain an edge. AstroFibonacci Ratios also prove that the motion of planets have a strong influence on what happens on earth. The Magi Society has developed a financial astrology software program we call AstroFibonacci. If you would like to read information about it or our Society, please click the link below:
Click here to read more information about AstroFibonacci and other software from the Magi Society.
All charts in this article were created by Magi Society's AstroFibonacci software.
|